Modeling the development of direction selectivity
Associating poorly correlated inputs
This work is by Jordan Feidler, Alan Saul, Aditya Murthy, and Allen Humphrey.
The full paper, "Hebbian learning and the development of direction selectivity: the role of geniculate response timings", published in Network:Computation in Neural Systems 8:195, 1997, can be viewed now as well.
Here are some of the figures, anyway. And some text, but this is still in
progress.
See my 1997 Neuroscience poster for some of the details of the actual development of response timing in the LGN.
INTRODUCTION
The perception of an object's direction of motion hinges on the existence of direction selective cells in visual cortex. In cat, about 80% of the neurons in primary visual cortex are direction selective. Although many cells are direction selective at eye-opening in kittens, cortex loses its direction selectivity through rearing in strobe illumination. Presumably the experience-dependence of direction selectivity is based on Hebbian mechanisms like those thought to underlie plasticity of ocular dominance and orientation selectivity.
Direction selectivity arises through convergence of inputs that differ in space and time. In cat, the temporal difference required for direction selectivity at low temporal frequencies is generated in the LGN via splitting the visual pathway into lagged and nonlagged components. In order for the spatiotemporally separate inputs to converge onto single cells, we suppose that they must be associated via Hebbian-type correlational mechanisms. This presents a problem that we discuss here and attempt to solve.
Spatiotemporal Quadrature
Direction selective receptive fields are built from (excitatory and/or inhibitory) inputs that differ in both space and time. Figure 1 shows an example of 2 receptive fields that resemble those of nonlagged and lagged LGN cells. Their sum is spatiotemporally oriented, like receptive fields of direction selective cortical simple cells. We want to emphasize, however, that this is only a highly simplified scheme used for illustration, and that we certainly do not think that actual simple cells receive only 2 afferents! We do think that simple cells receive many inputs, both afferent and intracortical, and that some of the inputs to direction selective cells are in approximate spatiotemporal quadrature.
Simplified Model
We analyze the problem in the frequency domain, and examine the case of 3 inputs competing for 2 connections to 1 postsynaptic cell. One input (purple/dark blue) has fixed temporal and spatial phase values (0,0). Another input (light blue) has fixed phase values in quadrature with the first (0.25,0.25). The third input (red) has phase values that vary. Shown here is the case where the red input is at (0.1,0.05). [See colored dots in Fig. 3]
Stimuli are drifting gratings. For rightward drift, the spatial and temporal phase values are subtracted; for leftward drift they are added. Thus, the quadrature inputs (purple and blue) respond in phase for rightward drift, and a half-cycle out of phase for leftward drift. The top row in fig. 2 shows the responses of the inputs, and the bottom row shows the sums of pairs of inputs.
Hebbian synapses encode correlations. Note that the quadrature inputs are only correlated for one direction, i.e. half the time. The red and purple inputs are well-correlated for both directions. Figure 3 maps the average correlation between the purple input and an input with variable phase. Quadrature inputs have a correlation of 0.5, which is lower than most other points in this space.
The PROBLEM is to associate quadrature inputs through Hebbian mechanisms despite their low correlation.
The SOLUTION is to emphasize the direction in which the quadrature inputs are in phase more heavily than the direction in which they are out of phase, thereby increasing their effective correlation.
This is done through postsynaptic resonance, as illustrated in Figure 4. The red circles with letters in Fig. 3 correspond with the location of the red input for each of the simulations shown in Fig. 4.
Figure 4: A B
C D
The results shown in figure 4 represent the outcome of the competition between the 3 inputs under 4 different conditions. In each case 2 of the 3 inputs maintain their synapses, and the other is lost. One would expect that the Hebbian learning would associate the 2 inputs with the strongest correlation, and this is what happens in the "control" condition shown in A. The other conditions are generated by making the inputs unrectified, and/or by using a nonlinear dependence on postsynaptic activity in the modification rule. Although we know that neuronal responses are rectified, the idea behind the unrectified inputs here is the popular idea that cortex tends to linearize its inputs through push-pull mechanisms. Thus, excitatory ON responses tend to be accompanied by inhibitory OFF responses, etc. In effect, assuming unrectified inputs permits us to include a simple form of inhibition in these simulations.
A. This is the result when rectified inputs and the linear postsynaptic dependence in the modification rule are used. The results are expected to match the correlation dependence shown in Fig. 3. Indeed, the purple (0,0) and red (0.05,0.21) inputs are associated even though they are slightly less well-correlated than the purple and blue inputs (because of random initial weights and randomness in the presentation order of the stimuli, the exact correlation structure is not seen in individual runs but only over a sample of runs).
B. Here the inputs are no longer rectified, but the modification rule still depends linearly on postsynaptic activity. This run is essentially a control for D, to show that linearizing the inputs is not enough to associate the quadrature pair. Here, the red (0.05,0.22) input wound up being associated with the light blue input, with which it has a correlation of about 0 (the correlation is easily calculated for the unrectified case to be cos2 Pi phi cos2 Pi psi), which is also the correlation between the quadrature pair for this case.
C. Postsynaptic resonance is implemented by making the postsynaptic rule depend sigmoidally on postsynaptic activity. Thus, when postsynaptic activity is low, little modification is made; when postsynaptic activity is high, modifications proceed. Because postsynaptic activity is enhanced when the quadrature pair are correlated (i.e., in the preferred direction) relative to when they are uncorrelated (the nonpreferred direction), the average correlation is exaggerated for the quadrature pair. Thus, the red input (0.05,0.15) can be made more similar to the purple input without blocking the association of the quadrature pair.
D. Both postsynaptic resonance and unrectified inputs are used for this simulation. The combination of these mechanisms creates a stronger tendency towards association of the quadrature inputs. Here, the red input (0.05,0.11) is fairly well correlated with the purple input, but still does not block the quadrature inputs from associating. The inhibition inherent in the unrectified inputs can now silence the postsynaptic cell, making the nonlinearity in the modification rule even more effective. But this inhibition is not effective by itself, as shown in B, but only in combination with postsynaptic resonance.
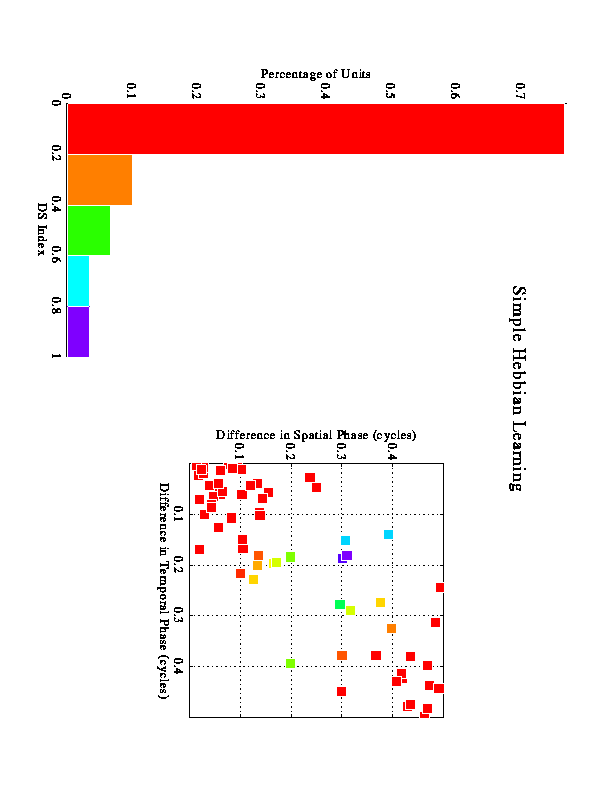
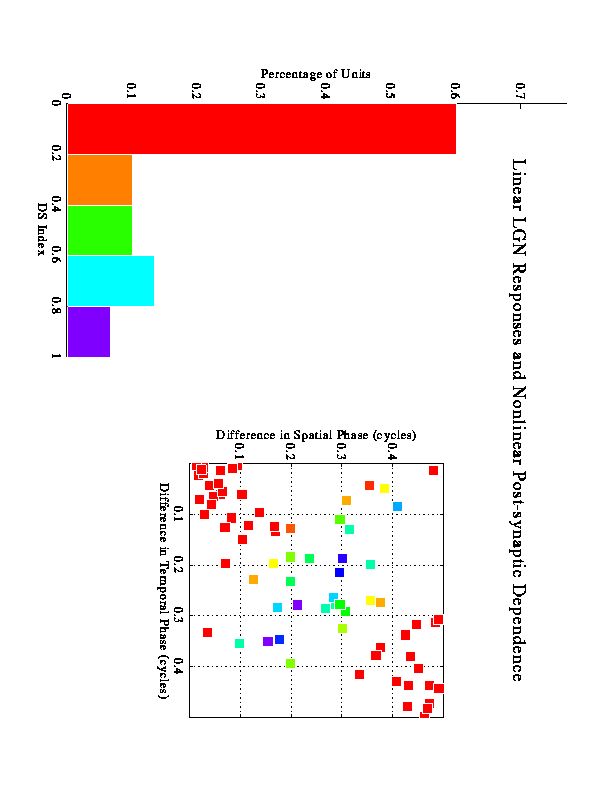
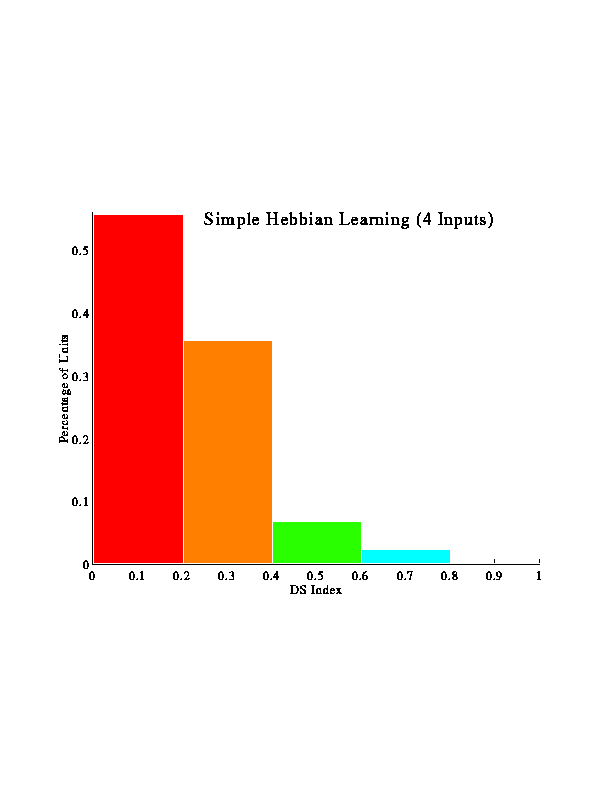
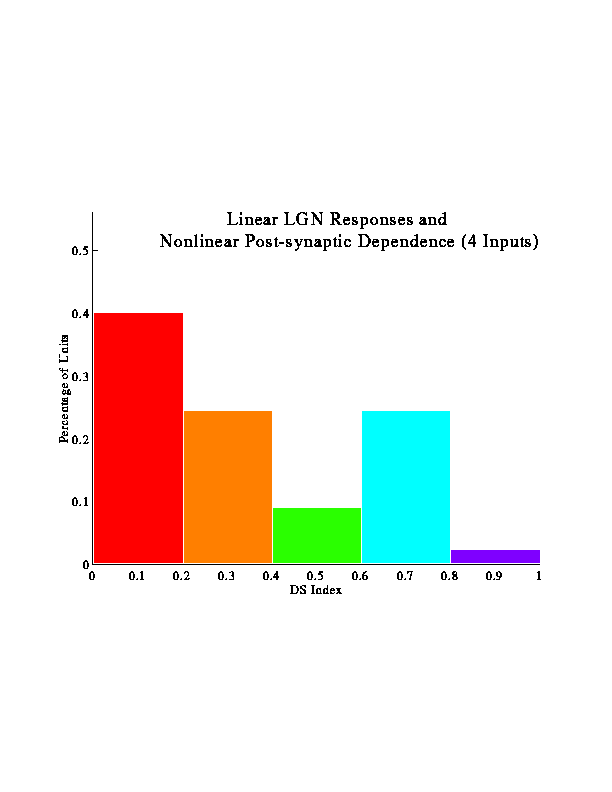
Larger-scale simulations were run to examine how many inputs with varying phases would behave. These figures represent results from multiple runs using 9 inputs for each run. The inputs were sampled from a distribution based on actual LGN data.
(to be completed...)


