Examples
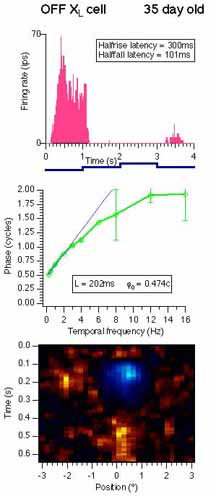
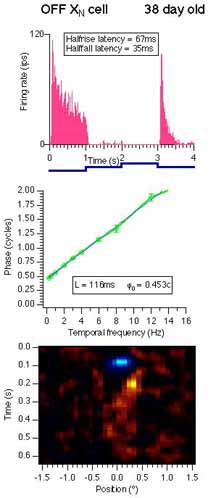
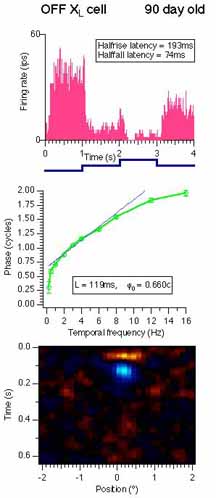
Relatively "immature" and "mature" lagged and nonlagged cells are shown to illustrate a small part of the range of variation seen. Three kinds of data are displayed here:
- responses to 4-part flashing spots (red histograms);
- response phase vs. temporal frequency in response to sinusoidally-modulated spots (green plots);
- space-time plots from sparse noise stimulation (blue and yellow maps).
"Immature"
 |  |
"Mature"
 |  |
Here are the same phase vs. frequency plots as above along with the amplitude data:
"Immature"
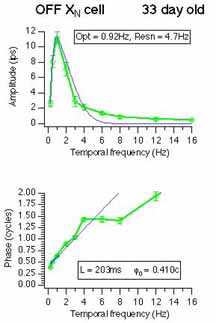 | 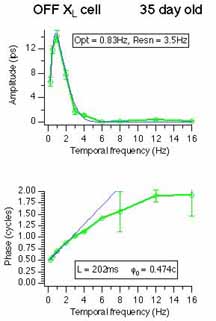 |
"Mature"
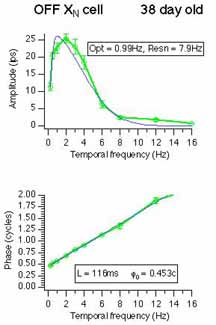 | 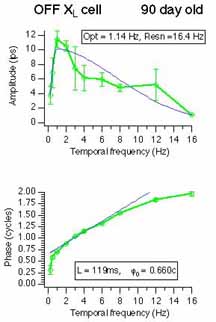 |
The "immature" lagged and nonlagged cells respond similarly. I categorized cells subjectively because I have not been able to arrive at objective criteria that work at all for the population (see below). The subjective criteria include evidence of anomalous offset discharges in the flashing-spot histograms and evidence of inhibition in the sparse noise maps. Both of these are hinted at in the "immature" lagged cell shown above, but not for the "immature" nonlagged cell. Note that they are quite clear in the "mature" examples. On the other hand, despite many "mature" features in the latter cells, the integration times (116ms and 119ms) are similar. Latencies in nonlagged cells are slow to mature.
Population results
Back to index
Date created: November 5, 1997
Last modified: November 5, 1997
Copyright © 1997, Alan Saul
Maintained by: Alan Saul
Alan Saul